Using LLMs to extract structured civic data

Parental leave civic hacking pt. 2 (previously): or, using LLMs to extract civic structured data from unstructured content. I tooted a while ago about finding some fun usage of LLMs to extract US rep local office phone numbers where a purely heuristic method failed spectacularly. I finally wrapped this up: we can now extract and update local office numbers from every single house and senate website automatically with my new office-finder tool.

Why is this important? 5 Calls needs an accurate list of local office numbers for our users. For members of the Senate who have many millions of constituents or even higher profile House reps, outpourings of public comment frequently overwhelm the main DC phones and, frankly, sometimes they just turn off the phones entirely or send everything to voicemail. Local offices are far easier to reach a human only by virtue of being less of a public face for a rep.

But these numbers are pretty hard to keep up to date! Basically the only way it happens is if someone emails 5 Calls saying “I tried this number and it didn’t work, my rep’s website says something else.” So having a script anyone can run to ensure everything is up-to-date simplifies this work by a lot… to the tune of 783 new offices, 406 outdated offices, and including 162 reps who previously had no local offices listed previously.

We’re also contributing this back: we use the fantastic united-states/congress-legislators repo as a base for representative information so contributing up-to-date info back to that repo is a win for everyone using it. This tool supports generating a file with the format used in that repo.

using LLMs to build the LLM tool

After a bit of playing around with coding-assist language model tools in previous small projects, the loop finally clicked for me on this so I leaned in while working on this and it definitely made me more productive.

I used Claude 3.5 sonnet both via the web interface for one-off questions (“remind me the syntax for doing x”) as well as the claude dev plugin for vscode for codebase-specific development. Claude dev was the more game-changing integration as it can answer questions using the context of your current project and actually do the work for you. I found myself using it to flesh out the command line arguments I was building, transform data from one model type to another, and prototype basic logic that I just didn’t feel like thinking deeply about.

I would note that it almost never gives me 100% of what I want to accomplish unless the task is incredibly simple, but it provides an immediate base to work on the actual problems that I want to solve and not the tedious remember-how-this-works or write-100-lines-of-boilerplate steps.

A typical example was writing a function that I knew had a couple different edge cases and doing a first pass on the happy paths, then asking Claude to write up test cases for the function. Claude Dev can create files so adding a new test was just clicking a button. Then I review the test cases and add the failing edge cases that I know exist, maybe clean up some redundant test cases that claude added. Then I can go back and focus on handling the edge cases immediately, staying focused on the problem I’m already solving.

A little more on the office-finder tool and things I learned while building it:

We want to parse the data from all of these websites into something machine readable. We can ask for it from the LLM in JSON format and it’ll happily produce some json but that’s not always in the correct format even if we are specific about what parameters we want in the prompt.

We’re late enough to the LLM game that the big providers have already solved this particular problem by providing ways to ask for structured output that is not subject to the same kinds of hallucinations that LLM answers sometimes provide. OpenAI and Gemini refer to this as “structured output”, anthropic has a “JSON mode” and certainly others have similar concepts. The idea is to strongly type the shape and outputs you want and then at the very least the keys will be correct even if the values are sometimes wrong.

(worth noting that pure LLMs are fun but somewhat useless in this regard and the value is really coming from the pairing of pure language model and a certain level of guaranteed correctness. I would certainly like to read more about how pairing these two things is accomplished!)

For the most part, addresses returned by this tool are correctly formatted and represent exactly what’s on the page. There are quirks though, so the process does require some level of human observation. For example, even though I describe how to break out the address, suite and building name in the prompt, sometimes I get an address back that includes a building name in the address field, or “N/A” for the suite field even though I asked for it to be omitted if it doesn’t exist. It’s important to be able to re-run the process for specific sites if one run just goes sideways.

I cache the address data in a local json file so I can either manually fix offices (a small handful of rep websites are structured significantly differently than others, making finding the address text very difficult) or check for changes by rerunning and diffing that file for certain sites. Then another command automatically pulls the existing local office file from the united-states/congress-legislators repo and merges in any changes.

I have some thoughts on what might improve this, like splitting the address extraction from the structured data request, but I have not experimented on if that gives better results yet. Since we’ll need to refetch offices for new reps in the 119th Congress at the start of 2025, perhaps I’ll pick up some of these improvements for that cycle.
DMs from your reps

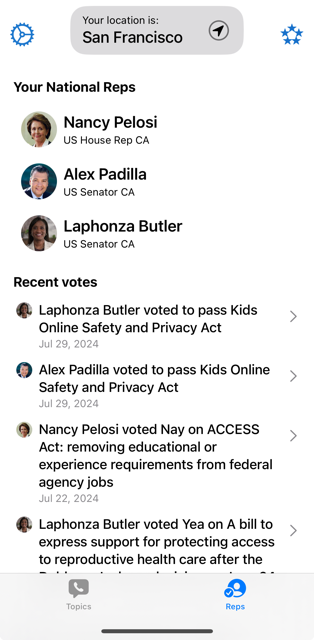
Parental leave civic hacking pt. 1: an updated 5 Calls app is out sporting a new “Inbox” tab with important votes and messages from your Reps!

A screenshot of the new 5 Calls inbox screen

I’ve always wanted to build ”DMs from your reps” for 5 Calls and I really solidified my belief that it was important earlier this year when, again, hundreds of thousands of (mostly young) people found the app through insta and tiktok as a way to express their frustration on the war against Palestine.

These young people have made an effort to contact their reps about an important topic to them, how do they know if their rep is doing what they asked? Inbox closes the loop for people who don’t read political news every day, and gives them a tangible reason to vote for or against their rep in the next election.

The other thing 5 Calls has always been pretty good at is curating important topics. We don’t write up every bill that’s introduced in Congress and that gives the uninitiated a sense of what is impactful to call on. Similarly, you can get push notifications for every Congressional vote from lots of places, we‘re offering a view into the important stuff that makes or breaks your opinion of their work (and ties it back to stuff you’ve called on!)

Curation is a lot more work than sending a notification every time the House approves a new Post Office name, so building tools to review and summarize bills has been about 80% of the work to get this out the door. And of course if you think this work is as important as we do, you can contribute here or pitch in on some of our open source projects on github.

118th Congress District Shapefiles

I’m a big fan of minimizing external dependencies and one of the moments forming my opinion on this was dealing with mapping user location to Congressional district for 5 Calls. This is a key part of 5 Calls: you enter an address or zip code and we return a set of representatives for various levels of government, including their phone numbers and various metadata that’s useful to you.

The very first version of 5 Calls used the Google Civic API to fetch this data which worked pretty well and included a geocoder so we could pass addresses, zip codes, etc and get back a description of the federal representatives for that point. This worked OK and there was a generous free tier but it was still an external API call adding to request latency and the service was less than responsive to changes in representative information, especially one-off changes that happen outside of election cycles.

Eventually we moved to a different service that was a hobby project for another civic tech-minded programmer, but it ended up being overly complex and, being a hobby project, was even less up-to-date with the latest changes in Congressional representation. It did use elasticsearch though, which had decent support for geospatial queries so I spun out using elasticsearch by itself for a while, adding some tools to spin up a dataset of district information from geojson files.

Elasticsearch was fast enough, but still an external service (not to mention an expensive one) that we needed to make an API call to before returning representative information. One day whilst fighting an upgrade to a new version and the AWS console all in one battle, I wondered how many polygons I could just fit in RAM and query using basic point-in-polygon algorithms. And from my experimentation it turns out I could store all of the congressional districts easily in RAM (simplified, but acceptably so) and query them in much less time that an external API call took.

This simplified approach has been working great for the last few years: download district data from the unitedstates/districts repo on startup, then when a request comes in geocode an address or zip code and figure out which polygon it’s in. As is typical in programming, I thought my options were systems that optimized for searching thousands or tens of thousands of polygons when in reality I only needed to pick from ~450.

We’ve had a handful of states redistricting over the last few years which I had to handle individually, but the real test was the start of the 118th Congress when new districts from the 2020 census came into effect. Most states had their district boundaries modified in some way as the population distribution moved around in the state, and if a state changed population enough to either gain or lose a House seat the district boundaries could be significantly different as they needed to either make room for a new district or absorb the former population from a lost one.

I spent a couple weeks digging up what tools to use and how to validate the new districts in a way that would let me manage all 50 states without doing too much manual work, here’s my process:


1. Aquire Shapefiles

All states will produce a district shapefile (a format managed by Esri, one of the major GIS companies) and sometimes geojsons or KML files, shapefiles were the common denominator so I only used those regardless of what else a state offered for download. Generally the congressional district shapefile is available on a legislature or state court website first, then eventually the census website. This part takes some googling.

2. Split And Convert

We (rather, the folks who run the unitedstates/districts repo) want each district in its own geojson file… alongside a KML file that has exactly the same info, but we’re interested in the geojson format for our own usage. Seeking to convert from a shapefile to geojson file leads to a number of tools and paths but a simple yet robust option seemed to be the mapshaper tool.

Combining a number of our tasks into one command, we can split a big shapefile into individual district geojson files, simplifying the paths and slimming the overall file size by reducing the precision by using this command:

mapshaper -i GA.zip -split -simplify 15% -o ga/ format=geojson precision=0.000001

Our input, GA.zip here, is four shapefile components, dbf, prj, shp, and shx files all zipped up into one archive. mapshaper is really powerful! I was surpised I could do so much with just running one command and there are lots of options for processing shape formats in various ways that I didn’t end up using.

Simplification reduces the amount of points in the shape to a percentage of the original points, with some heuristics to maintain shape detail when possible. I tried to simplify into a similar filesize as before, i.e. if all of Alabama’s geojsons were ~500kb previously, I tried to hit that number again with the assumption that anyone currently reading the files into memory would be able to do the same with these updated shapes. Some of the sources are quite large and leaving them unsimplified would surely break some implementations that depend on this data.

I could probably use a more rigorous approach as to how complex the shapes should be for the purpose but in the absence of that, this seemed like the best way to aim for a particular size.

Reducing the precision to 6 decimal places means that we can only tell distances down to a tenth of a meter but that seems like a fair tradeoff for our usecase as well.

Sometimes this complains (warns, but doesn’t fail) on there not being a projection available. If you miss it during this pass, you’ll definitely notice the very large floats as points in your geojsons later. The solution is to force the wgs84 projection with -proj wgs84 as part of the mapshaper command.

3. Validate

Now the nitty-gritty. How had each of these states formatted their files? Did they include relevant metadata for their districts? We needed to be sure that we had the right districts mapped to the right representatives across ~450 files without doing everything by hand - as well as creating folders and files in the correct place for the repo that we are contributing to1.

There’s no great way around this: I had to parse the json, being flexible for various ways states had described their districts, and then reformat them correctly before writing out the files. Go is not a great choice for this given its somewhat strict JSON parsing behavior but I can always churn out some Go without much thought to syntax or special libraries so I picked that.

This mostly went without drama. I did assume originally that the shapefiles listed each district sequentially and numbered them as such before realizing that is absolutely not a good assumption and going back to parse whatever district number was in each shape metadata. The only hangup here was Michigan which for some reason misnumbered its districts in the original shapefile.

The code in question is in my fork of the district repo (it probably will not be merged to the original one) and can be run with go run . -state GA.

4. Add KML

The repo wanted KML files sitting alongside the geojson files so I had to figure out how to generate KML files from geojson files. Unfortunately KML is not supported by mapshaper so I had to look elsewhere. One of the other options that I had originally considered for converting shapefiles originally was ogr2ogr from the GDAL library. It didn’t have the processing options I was looking for but it could easily turn a geojson file into a KML file, so a little bash was able to convert all the district files for each state:

for i in {1..8}
do 
    ogr2ogr WI/WI-$i/shape.kml WI/WI-$i/shape.geojson
done

Other than a couple minor fixes for importing the files into the 5 Calls API during startup, that was the whole processing pipeline for all 50 states’ worth of district files. Most states went smoothly through all the steps without any manual intervention but naturally the states with weirdness took a bit of time to work out the special cases.

I’m pretty happy now with both the way we consume the files as well as how they’re processed. I could easily redo this again in ten years (!!!) and I imagine I’d only have to make minor changes.


  1. [1] unitedstates/districts is supposed to be CC0-licensed data, i.e. reformatting of free data published by the government itself. I didn’t get all my data from sources that would be OK with republishing so I’ll wait until the census publishes the shapefiles before I submit something that can be PR-able to the original repo. ↩︎

Finally, Apple Music cadence playlists for running

I took about a month off between my last job and my current one to ostensibly do some work around the house but also to wrap up work on my running music app that I’ve been working on; Runtracks.

The inspiration was simple: when a track comes on while you’re running and it perfectly matches your step cadence, it feels great! Why can’t we do this for every track in your running playlist?

Runtracks is a set of curated tracks from Apple Music that are perfect for running, combined with software that adjusts the beat of the music to match your run cadence.

And honestly, it’s great to use. I have been running mostly on a treadmill since covid began and being able to dial in a speed and cadence and have music to go along with it just feels great. More recently I have started running outside again and the experience is just OK - hills will make you speed up or slow down just enough to get out of sync - but that’s nothing a few more features can’t fix.

Right now it’s 100% free to use, other than having to be an Apple Music subscriber already. Like any good app, the software is only half the story and regular content updates is really what makes it continually valuable. As a few features solidify and I feel more comfortable focusing more on content and less on the core functionality, I’ll probably add a very cheap subscription option to keep the content flowing.

If you’re a runner (or if you’re not and want to be!), download Runtracks on the app store and give it a shot. As always, shoot me some feedback if you have ideas for features or if you had a good run.

Home Temperature Logging with homebridge, Influxdb and Grafana

We recently were able to buy our first house (!!! it does still seem a bit surreal) and a flood of projects that I’ve never quite been able to commit to in a rental have been added to my todo list.

One of those was setting up historical temperature charts for indoor spaces, and in general just building out some fun homekit integrations without shelling out lots of $$$ for expensive sensors. You can definitely achieve this without homekit and homebridge in the middle if you don’t care about that part but the homekit plugins do provide some plumbing to connect bluetooth to mqtt to influxdb with only light configuration.

This is the culmination of a twitter thread I started a while back:

sensor choice

I started with a few homekit native temperature sensors, the cleargrass CGG1 model, which were expensive but very easy to connect directly to homekit. Unfortunately there’s no way to get data out of homekit, so to plot the values over time you need an intermediary to fetch the sensor data over bluetooth and then you can fake a new accessory that homekit can display, hence the connection through homebridge.

All of the common sensor models I looked at have some sort of encryption around the data they transmit, so you have to get the “bindkey” through various semi-hacky gist paste methods. It seemed like other folks were able to decrypt the CGG1 bindkey using fake android apps or syncing their hardware with some cloud service and then fetching it via an API, but none of those methods ended up working for me and the CGG1.

That rabbit hole lead me to another sensor that was significantly cheaper because it had no native homekit integration (which I didn’t want now anyway) and a slightly smaller screen: the Xiaomi Mijia LYWSD03MMC. Rather than $30 per sensor, these could be purchased for as low as $5 each in packs of four!

Even better, the LYWSD03MMC seemed like it had some of the best tooling for installing custom firmware which removed the data encryption and added some extra features. I purchased two to get started.

bluetooth hardware

Before I get into how everything connects together, a short interlude on bluetooth on Ubuntu. It’s awful and I spent too much time fighting it versus just doing the thing I wanted to accomplish.

Or at least the native chipset in the little M1T hardware I’m using sucks. Lots of people report success with using bluetooth on Raspberry Pi models, which is a common platform for homebridge installations. You can see my whole journey in the twitter thread, but the short version is that the bluetooth device would disappear entirely after 6-to-12 hours and no amount of sudo hciconfig hci0 reset would fix it. Or any other bluetooth incantation short of a system restart for that matter.

I ended up getting a tiny bluetooth dongle from TP Link, their UB400 model, which a) was plug-and-play on linux, if you can believe it b) had significantly better range than internal bluetooth and c) didn’t constantly disappear from the machine.

Don’t fight flaky bluetooth chipsets on linux. Just get a cheap dongle that is well supported.

reflashing the sensors

Not nearly as scary as reflashing devices used to be. Here is a web reflasher (yes, really!) for these devices. You have to enable the#enable-experimental-web-platform-features flag in Chrome, instructions for that are on the page.

The UI is not great here but it’s a fairly simple process and you can do it on any machine with bluetooth, not just the homebridge server.

  • Download the firmware from the “Custom firmware repo” link on that page, it’s a ATC_Thermometer.bin file
  • Enter the BLE device name prefix so you don’t see every bluetooth device nearby. If stock firmware, use LYWSD03 but after you flash it, it will appear as ATC (the name of the firmware) instead
  • Click Connect
  • After a few seconds you should see the device pop up in the bluetooth pairing window of Chrome. Select it and Pair
  • The log at the bottom of the window will tell you when it’s connected
  • Click Do Activation when it’s connected
    • You can ignore the token and bindkey, we’ll be disabling it with the new firmware
    • If the MAC address like A4:C1:38:B7:CB:10 shows up in the Device known id field, note it somewhere but this was hit or miss for me and we can get the MAC later as well
  • Select the previously downloaded firmware file at the top of the page under Select Firmware and click Start Flashing, it’ll take 20 seconds or so to finish up
  • Once it restarts, customize with the controls in the middle section of the page to your liking, I selected:
    • Smiley: Off
    • Advertising: Mi-like
    • Sensor Display: In F˚
    • Show Battery: Enabled
    • Advertising Interval: 1 min
  • After selecting each of these, the sensor will update with the new setting immediately. You MUST click Save current settings to flash to persist your settings between restarts
  • If you didn’t get the MAC from the earlier step, simply remove the battery and pop it back in to restart the sensor. The new firmware ensures that while booting the humidity digits will read out the last three bytes from the MAC address, the first three are always A4:C1:38

connecting the dots

Now it’s “just” a matter of stringing all the components together. Here is a list of the bits and pieces that are connected:

Locally:

Somewhere (local or remote):

  • InfluxDB
  • Grafana

I’m opting not to run Influx and Grafana myself because the free cloud offerings are a good start. Grafana is really just a frontend to influx data and thus doesn’t even need to be running most of the time, so Heroku is a good option if you want to run it yourself (tailscale even offers a nice way to spin one up that lives on your tailscale network). The limitation on the free offering is 30 days data retention on influx and the next tier is usage-based, which I imagine would be reasonable for the amount of data we’re throwing at it.

Once you have influx set up, you can configure the next step: sending data to influx with telegraf. Install telegraf using the standard instructions.

[[inputs.mqtt_consumer]]
servers = ["tcp://localhost:1883"]
topics = [
  "sensors/#",
]
data_format = "csv"
csv_header_row_count = 0
csv_skip_columns = 0
csv_column_names = ["value"]
csv_column_types = ["float"]
csv_delimiter = " "

[[outputs.influxdb_v2]]
urls = ["https://us-west-2-1.aws.cloud2.influxdata.com"]
# an auth token from influxdb cloud, Load Data -> API Tokens -> Generate API Token
token = "XXXXX"
# your email or org id from your influxdb account
organization = "email@example.com"
# your bucket name, create this on influx first, Load Data -> Buckets -> Create Bucket
bucket = "homebucket"

Create a config file like this in /etc/telegraf/telegraf.d/, naming it something like mqtt-to-influxv2.conf. You can throw it all in a single top level .conf file too but it’s nice to be organized. Restart telegraf. Telegraf will now forward from mqtt to your influxdb instance.

Note the topics section. We’ll be organizing our mqtt topics to look like sensors/garage/temperature so this tells telegraf to forward everything that starts with sensors/.

Next step: forwarding messages via mqtt. Install mosquitto (mqtt) and a client in case you need to test the output. Generally you can do sudo apt-get install mosquitto mosquitto-clients or the mqtt github readme for other platform instructions.

If you need to test that mqtt messages are being sent, you can use mosquitto_sub -h 127.0.0.1 -t sensors/# -v and it will display messages as they arrive. No other mqtt config is required.

Next step: sending messages from your bluetooth devices to mqtt.

I won’t get into installing homebridge, but I highly suggest you add homebridge-ui to manage your instance. That way you can pop this url for the mi temperature sensor into the plugin search and install it easily.

Once it’s loaded into homebridge, use homebridge-ui to configure the plugin by using the Settings link on the plugin page. It should have your first accessory already created and you should fill in these values:

  • Device MAC address: the MAC address we got while flashing the device
  • Expand the MQTT section
    • Broker URL: mqtt://localhost:1883
    • Topics: use a format like sensors/garage/temperature as we discussed above, and name your temperature, humidity and battery topics distinct names
  • Save and restart homebridge

Click Add Accessory to duplicate these fields for another sensor, so you can add as many as you like, but be sure to change the MAC and mqtt topics at a minimum.

If you’re you’re not down with homebridge-ui and are writing your homebridge config by hand, use the plugin docs to figure out which json config keys to use for the same items above.

I cribbed a lot of the setup from homekit to mqtt to telegraf from this reddit post on building a homebridge to grafana pipeline, updating it for the influxdb_v2 output. I think the order of operations is weird in that post but the config steps do work out in the end.

That’s it! Your sensors should be publishing data to mqtt, which is passing it to telegraf, which is adding it to your influxdb instance.

graphing your data

The last step is exploring your data on influx and grafana to configure a dashboard. This is subjective depending on what you want to see, so you can play around with it as you see fit. Some guidance to get started though:

Queries are arguably better to design in influx since you can more easily browse what data is available using the Data Explorer tool. You can click through your bucket’s data to roughly select the data you’re looking for, then click Script Editor to get a query for that data which can be pasted into a grafana panel.

For example, here’s a query from one of my temperature panels:

import "math"

convertCtoF = (tables=<-) => 
  tables
    |> map(fn: (r) => ({
        r with
        _value: (r._value * 1.8) + 32.0
      })
    )

from(bucket: "homebucket")
  |> range(start: v.timeRangeStart, stop: v.timeRangeStop)
  |> filter(fn: (r) => r["_measurement"] == "mqtt_consumer")
  |> filter(fn: (r) => r["topic"] == "sensors/garage/temperature")
  |> convertCtoF()
  |> aggregateWindow(every: v.windowPeriod, fn: mean, createEmpty: false)
  |> yield(name: "mean")

The bottom part from(bucket: "homebucket"... is based on a query I created in the influx data explorer and then I added a quick conversion step from C˚ to F˚. This is influx’s flux query language which is not always easy to understand but between the reference docs and asking questions on their support forum, you can probably come up with what you want to do.

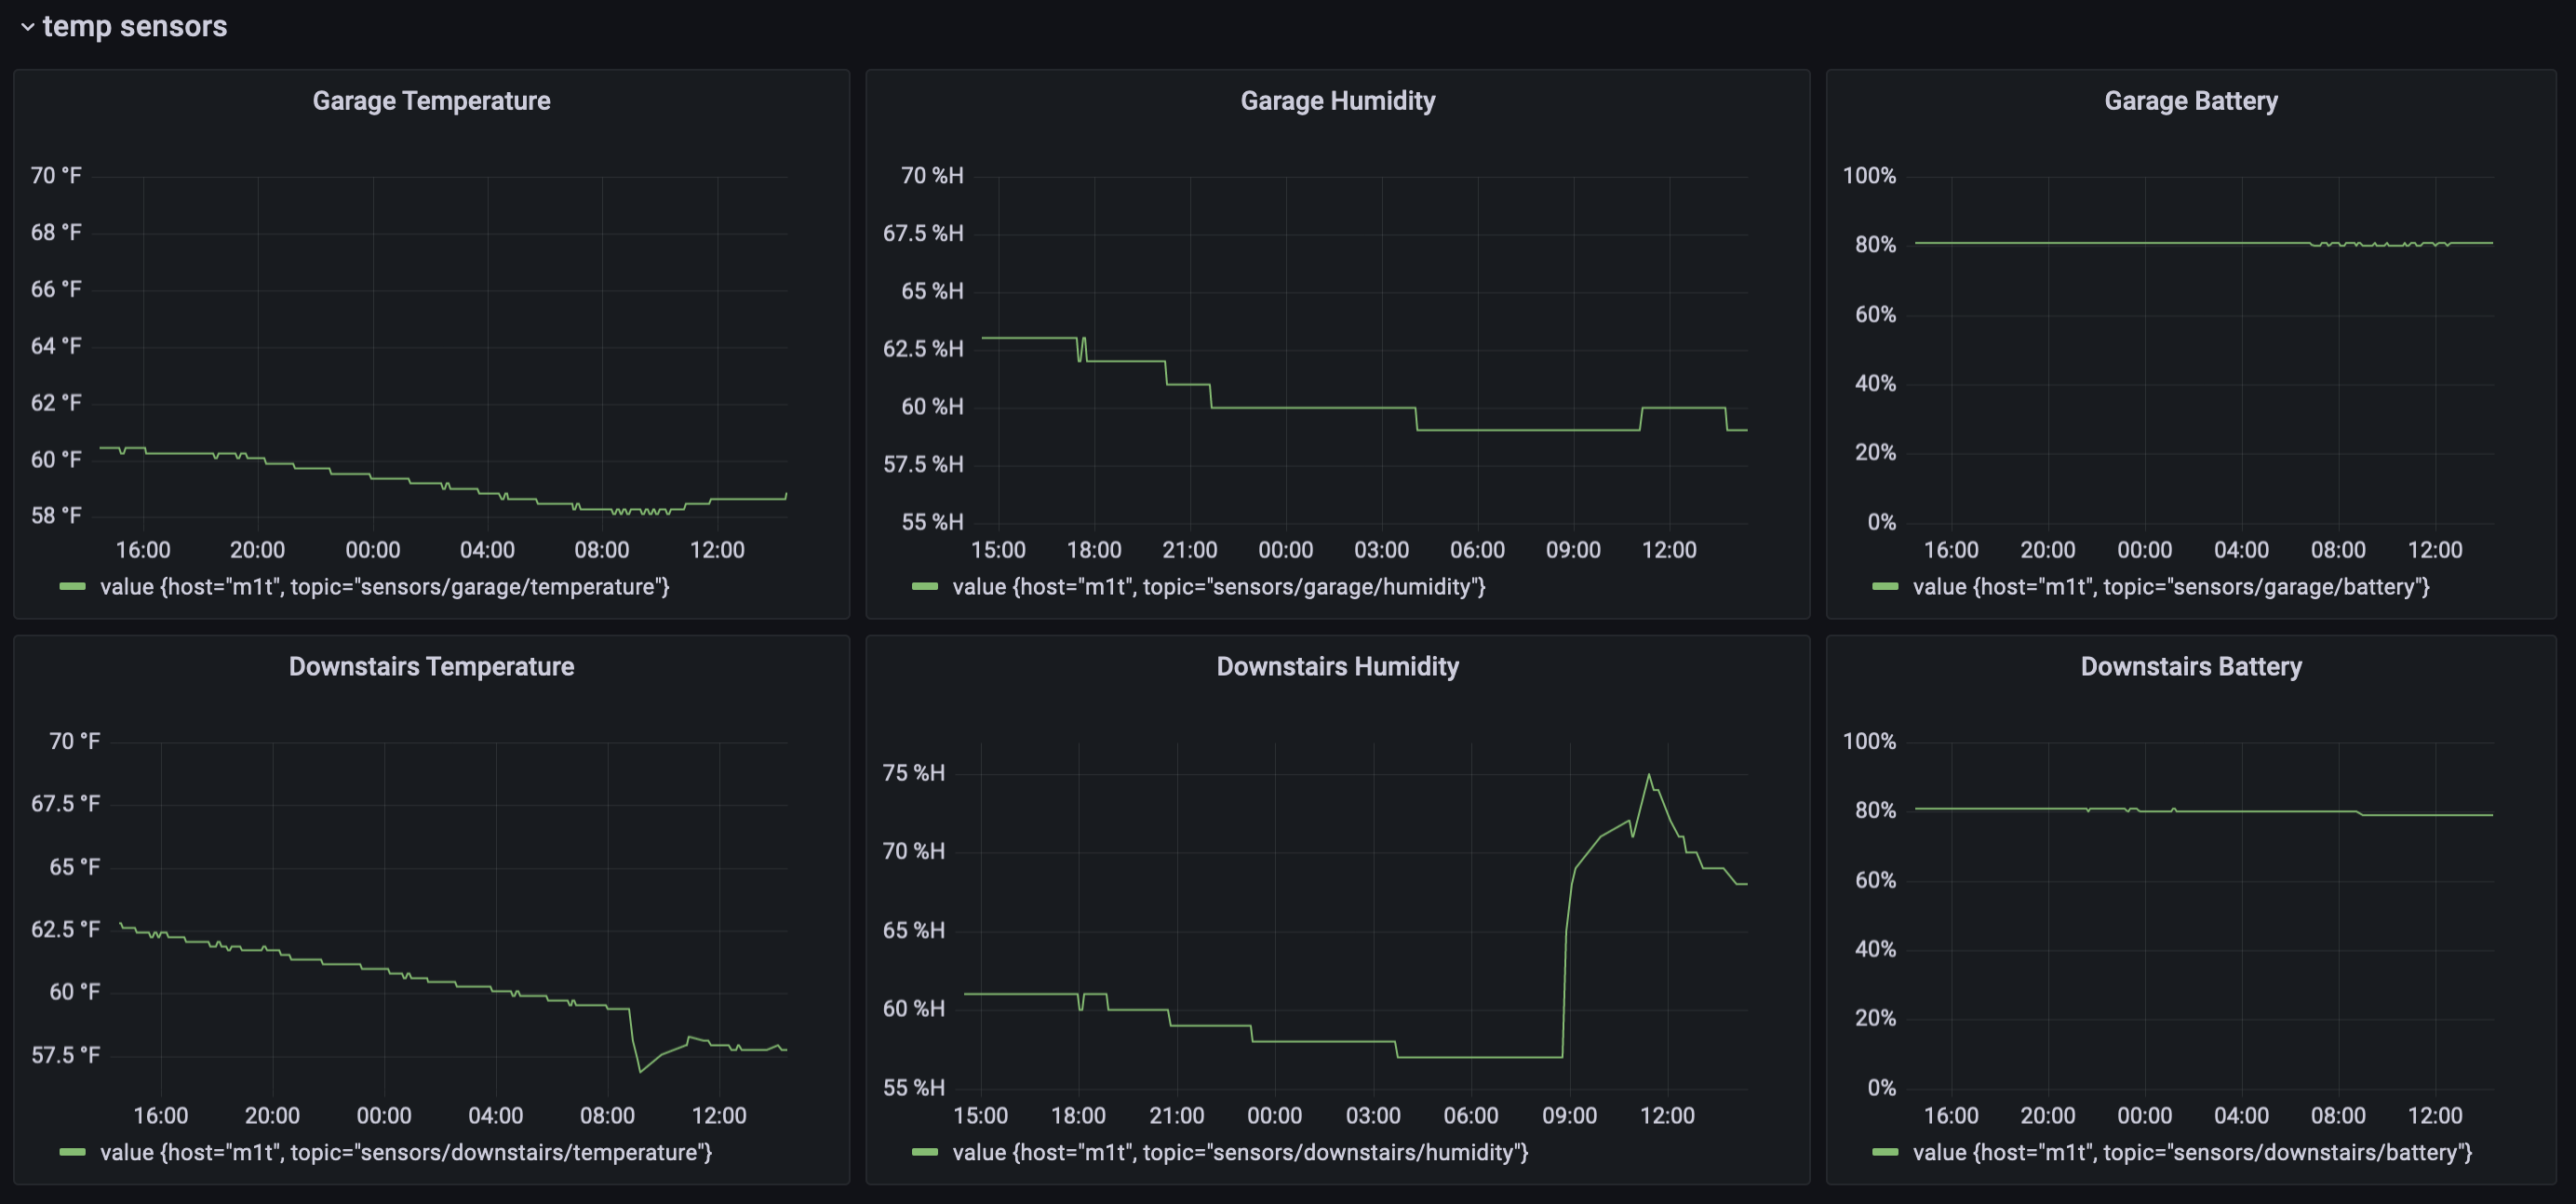
grafana graphs for two temperature sensors

Once you have the query set, you can continue to customize by adding a title, soft min and max values and, most importantly, your units.

additional sensors?

What else? Got other sensors that can be read over bluetooth and forwarded to influx? Random other things that can publish mqtt topics that are not homekit related? Now that you have the basics for an influx pipeline on your homebridge server, the possibilities are endless.

Questions? Did you extend this in fun ways? Let me know on Twitter.

Next time: let’s use our existing infrastructure to do home network monitoring!

Developer Documentation Is Awful

I’m working through a rewrite of the 5 Calls site to static publishing via hugo (same as here) but with the addition of dynamic content via small React components. I don’t see this approach in a lot of places but so far I think it’s very effective, I’ll talk about the specifics at some point in the future.

Because I’m not just building features into an existing architecture, I’m doing a lot of experimenting with how to accomplish what I want in a minimal, clean way. Some specifics about why that process is difficult for programmers follow…

Although I have a pretty good sense of React after running the regular 5 Calls site as a SPA for a few years and dealing with React Native both at my regular job and for 5 Calls’ relational app, Voter Network, I still run into situations where I want to accomplish a specific thing in React and just have no way to figure out what is the right way to do it.

This process isn’t about writing the code, it’s about understanding the purposes and limitations of the framework which is… 90% of programming. So we turn to Google to try to figure this stuff out and that doesn’t always work well:

It struck me today how incredibly low-tech this is. One side of me appreciates the community aspect of it; most cases bring you to a stack overflow question (low quality questions excepted) or a blog post on some engineer’s website which can be incredibly informative. But the other side of me wonders why there is so much room for instructions on how to accomplish things.

I’ve returned to this a few times recently as I’ve been evaluating projects that I’m working on. We get hung up on “I’m an engineer that knows Swift” or whatever language when that’s barely 10% of the actual work for most engineering jobs. I am relieved when I hit part of a project that only requires writing logic in language x because it’s so straightforward, even for languages that I’m not super familiar with.

Unless you’re at unspecified fruit company writing actual subsystems, you’re mostly working within frameworks and libraries that you’ve decided to use and architecting your code around how those parts work is vastly more difficult than structuring the code itself.

With that in mind, why is documentation so insufficient? Even for a large, well maintained project like React it’s difficult to find out what the right pattern is for what your code is trying to do. High-level examples are exceedingly hard to find, particularly when they do something outside of the norm.

No grand resolutions on how to deal with this. Just thoughts on what’s broken for now.

Custom Homebridge Plugin for Garage Homekit

Funny story, a few weeks ago I locked myself out because technology. I left the house via the garage to see some neighborhood commotion and realized when I came back that I had been hoodwinked by my own code.

You see, I typically let myself in via a custom developer-signed app that travels out over the internet, back in to the house via a reverse proxy and then triggers an Arduino+relay connected to the door opener. It’s got… a few single points of failure. But it has been quite reliable until that week when I left the house without checking the app first. Developer certificates for apps only last until your current membership expires (at most a year if you installed an app on the day you renewed your membership) and mine had renewed since the last time I used the app - one of the secret perils of extended work-from-home I guess.

But everything worked out and I was able to get back in relatively quickly (quoth @bradfitz: “luckily you have a friend with backdoor access to your home network”) but it prompted me to tackle a project I had been putting off for a while; migrating from a custom app to a custom homebridge plugin.

HomeKit is by far more optimal for this use case: I can ask Siri to trigger it without writing my own Siri intents (which I did for the original app - except HomeKit has a monopoly on asking Siri to open the garage so I had to configure it for “hey Siri open the thing”), the user interface is built-in to the HomeKit app and won’t expire periodically, and I can rely on HomeKit Apple TV home hub rather than a reverse proxy. Less stuff I have to maintain or debug, and the only way I can be truly locked out is if the power is shut off.

getting started

As is customary, the actual code to wire all this stuff up is trivial but understanding the concepts behind the homebridge API is not.

I already had homebridge set up and configured for another project so I focused on how I could create a custom plugin for homebridge and connect it to my existing installation. I started by forking this example plugin project for homebridge: https://github.com/homebridge/homebridge-plugin-template

The installation instructions were great and I had the plugin showing up in homebridge-ui immediately.

Here’s where things start to get tricky: HomeKit garage door support is built with the idea that there’s a sensor that can detect if the garage door is open or closed. This isn’t typically something a non-smart garage door can tell. It’s got a toggle that opens, closes or stops movement from the garage door and your eyes and brain are the indicator that the door has completed opening or closing.

If you look at the Homebridge Garage Door service API docs, you’ll note that it handles a few different states. There is no “toggle garage door” command, but there are triggers for setting the CurrentDoorState and TargetDoorState. In an ideal world we’d trigger the garage door toggle, set TargetDoorState to open, wait for the garage to open and then set CurrentDoorState to open.

Next time:

How to structure your homebridge plugin, and trying things the hard way…

New Zealand Flax Pods

Earlier this year I noticed one of the bushes in the backyard was sending off a bunch of flowers, more than I’ve ever seen on this one bush for sure, and now they’ve fulled developed into seed pods. These were impressive even when they were pre-bloom, they’re probably 8 feet tall and there are something like 10 flowers per stalk over seven stalks that the plant produced this year.

I thought these were super fascinating so I grabbed a few pictures. Turns out these are a variety of Phormium, or New Zealand flax, with bright pink stripes along the side of the broad leaves.

Seeds from New Zealand flax bush

Putting on my very unofficial botanist hat, the pods most likely open up and let their seeds out when they’re still quite high above the ground. The seeds, inside their disk-shaped hulls, then catch the wind, spreading farther than they would if they just dropped directly down.

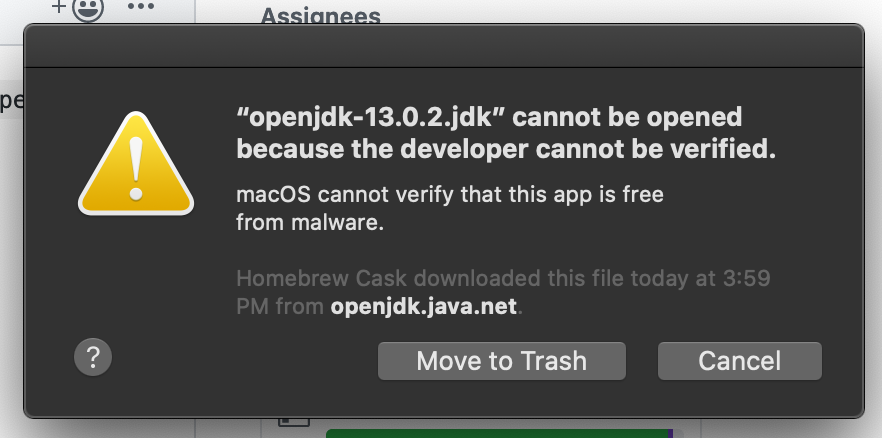
openjdk cannot be opened because the developer cannot be verified when installing adb via brew

openjdk cannot be opened because the developer cannot be verified when installing adb via brew

If you’re like me and enjoy the simplicity of installing command line tools using the brew command on macOS, you’ve likely run into one or two cases where Catalina prevents you from running a tool that’s been installed because it hasn’t been verified.

In this case, I’m installing the android developer tools for React Native development and needed both adb and openjdk. I’ve used both of these commands to install them:

  • brew cask install android-platform-tools
  • brew cask install java

This situation is similar to downloading a new Mac app from any developer online. Some developers want to distribute apps without the restrictions placed on them by Apple and can run unsigned code - with some restrictions.

The Solution

The issue is that macOS labels all downloaded binaries with a “quarantine” attribute which tells the system that it should not be run automatically before being explicitly approved by the user.

If you’re installing an app, the sneaky way to allow opening unsigned code is to use Right Click -> Open rather than double clicking on the app icon itself. That’ll allow you to approve removing the quarantine and you can open with a double click next time.

This even works in some cases with command line tools: you can use the open some/path/to/a/folder from Terminal to open a folder in the finder that contains adb and then right click it to get the standard bypass quarantine prompt.

The JDK is more tricky since it’s a folder and not an application. You can’t just right click to launch it, instead you have to manually remove the quarantine attributes from the folder where it’s been downloaded. You can do this easily in the terminal with this command:

xattr -d com.apple.quarantine /Library/Java/JavaVirtualMachines/adoptopenjdk-13.0.1.jdk

The command line tool xattr is used for modifying or inspecting file attributes on macOS. The -d flag removes an attribute, com.apple.quarantine is the quarantine attribute for unsigned code we discussed earlier and the final argument is the path to the file. Your jdk might have a different version or a different tool might be in an entirely different location.


As usual, quarantine is there to protect your computer from unsigned software. Please ensure you trust the developer you’re running unsigned code from before opening it on your machine.

React Native, Typescript and VS Code: Unable to resolve module

I’ve run into this problem largely when setting up new projects, as I start to break out internal files into their own folders and the project has to start finding dependencies in new locations.

In my case, it was complaining about imports from internal paths like import ContactPermissions from 'app/components/screens/contactPermissions';.

The error message tries to help by giving you four methods for resolving the issue, which seem to work only in the most naive cases:

Reset the tool that watches files for changes on disk:

watchman watch-del-all

Rebuild the node_modules folder to make sure something wasn’t accidentally deleted

rf -rf node_modules && yarn install

Reset the yarn cache when starting the bundler

yarn start --reset-cache

Remove any temporary items from the metro bundler’s cache

rm -rf /tmp/metro-*

These cases might work for you if your problem is related to external dependencies that may have changed (maybe you changed your node_modules without re-running yarn or installed new packages without restarting the packager).

In the case with VS Code, this did not resolve my issues. I was still running into issues where modules could not be found.

The Solution

The problem here turned out to be related to VS Code’s typescript project helper. When I referenced existing types in my files, VS Code was automatically importing the file for me - this is usually very helpful!

But for whatever reason, the way my app is set up means that even though VS Code could tell where app/components/screens/* was located (an incorrect import path usually causes VS Code to report an error on that line), typescript had trouble determining where this file lived from this path. Even being more specific about the start of the path with ./app/components/... was not working for the typescript plugin.

What did work was using relative paths in my typescript files. So instead of referencing files from app/components/screens/contactPermssions, I would use ../components/screens/contactPermissions for a file that was located in a different subdirectory of app.

This can be difficult to do manually (remembering what path you’re in and how many directories to go back up, etc), but VS Code can also generate and change these imports for you if it’s configured to do so.

Navigate to your workspace settings, search for typescript import and change the Typescript Import Module Specifier to relative from auto.

Or, do this in your preference json:

"typescript.preferences.importModuleSpecifier": "relative"