We recently were able to buy our first house (!!! it does still seem a bit surreal) and a flood of projects that I’ve never quite been able to commit to in a rental have been added to my todo list.
One of those was setting up historical temperature charts for indoor spaces, and in general just building out some fun homekit integrations without shelling out lots of $$$ for expensive sensors. You can definitely achieve this without homekit and homebridge in the middle if you don’t care about that part but the homekit plugins do provide some plumbing to connect bluetooth to mqtt to influxdb with only light configuration.
This is the culmination of a twitter thread I started a while back:
sensor choice
I started with a few homekit native temperature sensors, the cleargrass CGG1 model, which were expensive but very easy to connect directly to homekit. Unfortunately there’s no way to get data out of homekit, so to plot the values over time you need an intermediary to fetch the sensor data over bluetooth and then you can fake a new accessory that homekit can display, hence the connection through homebridge.
All of the common sensor models I looked at have some sort of encryption around the data they transmit, so you have to get the “bindkey” through various semi-hacky gist paste methods. It seemed like other folks were able to decrypt the CGG1 bindkey using fake android apps or syncing their hardware with some cloud service and then fetching it via an API, but none of those methods ended up working for me and the CGG1.
That rabbit hole lead me to another sensor that was significantly cheaper because it had no native homekit integration (which I didn’t want now anyway) and a slightly smaller screen: the Xiaomi Mijia LYWSD03MMC. Rather than $30 per sensor, these could be purchased for as low as $5 each in packs of four!
Even better, the LYWSD03MMC seemed like it had some of the best tooling for installing custom firmware which removed the data encryption and added some extra features. I purchased two to get started.
bluetooth hardware
Before I get into how everything connects together, a short interlude on bluetooth on Ubuntu. It’s awful and I spent too much time fighting it versus just doing the thing I wanted to accomplish.
Or at least the native chipset in the little M1T hardware I’m using sucks. Lots of people report success with using bluetooth on Raspberry Pi models, which is a common platform for homebridge installations. You can see my whole journey in the twitter thread, but the short version is that the bluetooth device would disappear entirely after 6-to-12 hours and no amount of sudo hciconfig hci0 reset would fix it. Or any other bluetooth incantation short of a system restart for that matter.
I ended up getting a tiny bluetooth dongle from TP Link, their UB400 model, which a) was plug-and-play on linux, if you can believe it b) had significantly better range than internal bluetooth and c) didn’t constantly disappear from the machine.
Don’t fight flaky bluetooth chipsets on linux. Just get a cheap dongle that is well supported.
reflashing the sensors
Not nearly as scary as reflashing devices used to be. Here is a web reflasher (yes, really!) for these devices. You have to enable the#enable-experimental-web-platform-features flag in Chrome, instructions for that are on the page.
The UI is not great here but it’s a fairly simple process and you can do it on any machine with bluetooth, not just the homebridge server.
- Download the firmware from the “Custom firmware repo” link on that page, it’s a
ATC_Thermometer.binfile - Enter the BLE device name prefix so you don’t see every bluetooth device nearby. If stock firmware, use
LYWSD03but after you flash it, it will appear asATC(the name of the firmware) instead - Click Connect
- After a few seconds you should see the device pop up in the bluetooth pairing window of Chrome. Select it and Pair
- The log at the bottom of the window will tell you when it’s connected
- Click Do Activation when it’s connected
- You can ignore the token and bindkey, we’ll be disabling it with the new firmware
- If the MAC address like
A4:C1:38:B7:CB:10shows up in the Device known id field, note it somewhere but this was hit or miss for me and we can get the MAC later as well
- Select the previously downloaded firmware file at the top of the page under Select Firmware and click Start Flashing, it’ll take 20 seconds or so to finish up
- Once it restarts, customize with the controls in the middle section of the page to your liking, I selected:
- Smiley: Off
- Advertising: Mi-like
- Sensor Display: In F˚
- Show Battery: Enabled
- Advertising Interval: 1 min
- After selecting each of these, the sensor will update with the new setting immediately. You MUST click Save current settings to flash to persist your settings between restarts
- If you didn’t get the MAC from the earlier step, simply remove the battery and pop it back in to restart the sensor. The new firmware ensures that while booting the humidity digits will read out the last three bytes from the MAC address, the first three are always
A4:C1:38
connecting the dots
Now it’s “just” a matter of stringing all the components together. Here is a list of the bits and pieces that are connected:
Locally:
- homebridge
- the homebridge-mi-hygrothermograph plugin
- mqtt
- telegraf
Somewhere (local or remote):
- InfluxDB
- Grafana
I’m opting not to run Influx and Grafana myself because the free cloud offerings are a good start. Grafana is really just a frontend to influx data and thus doesn’t even need to be running most of the time, so Heroku is a good option if you want to run it yourself (tailscale even offers a nice way to spin one up that lives on your tailscale network). The limitation on the free offering is 30 days data retention on influx and the next tier is usage-based, which I imagine would be reasonable for the amount of data we’re throwing at it.
Once you have influx set up, you can configure the next step: sending data to influx with telegraf. Install telegraf using the standard instructions.
[[inputs.mqtt_consumer]]
servers = ["tcp://localhost:1883"]
topics = [
  "sensors/#",
]
data_format = "csv"
csv_header_row_count = 0
csv_skip_columns = 0
csv_column_names = ["value"]
csv_column_types = ["float"]
csv_delimiter = " "

[[outputs.influxdb_v2]]
urls = ["https://us-west-2-1.aws.cloud2.influxdata.com"]
# an auth token from influxdb cloud, Load Data -> API Tokens -> Generate API Token
token = "XXXXX"
# your email or org id from your influxdb account
organization = "email@example.com"
# your bucket name, create this on influx first, Load Data -> Buckets -> Create Bucket
bucket = "homebucket"
Create a config file like this in /etc/telegraf/telegraf.d/, naming it something like mqtt-to-influxv2.conf. You can throw it all in a single top level .conf file too but it’s nice to be organized. Restart telegraf. Telegraf will now forward from mqtt to your influxdb instance.
Note the topics section. We’ll be organizing our mqtt topics to look like sensors/garage/temperature so this tells telegraf to forward everything that starts with sensors/.
Next step: forwarding messages via mqtt. Install mosquitto (mqtt) and a client in case you need to test the output. Generally you can do sudo apt-get install mosquitto mosquitto-clients or the mqtt github readme for other platform instructions.
If you need to test that mqtt messages are being sent, you can use mosquitto_sub -h 127.0.0.1 -t sensors/# -v and it will display messages as they arrive. No other mqtt config is required.
Next step: sending messages from your bluetooth devices to mqtt.
I won’t get into installing homebridge, but I highly suggest you add homebridge-ui to manage your instance. That way you can pop this url for the mi temperature sensor into the plugin search and install it easily.
Once it’s loaded into homebridge, use homebridge-ui to configure the plugin by using the Settings link on the plugin page. It should have your first accessory already created and you should fill in these values:
- Device MAC address: the MAC address we got while flashing the device
- Expand the MQTT section
- Broker URL:
mqtt://localhost:1883 - Topics: use a format like
sensors/garage/temperatureas we discussed above, and name your temperature, humidity and battery topics distinct names
- Broker URL:
- Save and restart homebridge
Click Add Accessory to duplicate these fields for another sensor, so you can add as many as you like, but be sure to change the MAC and mqtt topics at a minimum.
If you’re you’re not down with homebridge-ui and are writing your homebridge config by hand, use the plugin docs to figure out which json config keys to use for the same items above.
I cribbed a lot of the setup from homekit to mqtt to telegraf from this reddit post on building a homebridge to grafana pipeline, updating it for the influxdb_v2 output. I think the order of operations is weird in that post but the config steps do work out in the end.
That’s it! Your sensors should be publishing data to mqtt, which is passing it to telegraf, which is adding it to your influxdb instance.
graphing your data
The last step is exploring your data on influx and grafana to configure a dashboard. This is subjective depending on what you want to see, so you can play around with it as you see fit. Some guidance to get started though:
Queries are arguably better to design in influx since you can more easily browse what data is available using the Data Explorer tool. You can click through your bucket’s data to roughly select the data you’re looking for, then click Script Editor to get a query for that data which can be pasted into a grafana panel.
For example, here’s a query from one of my temperature panels:
import "math"

convertCtoF = (tables=<-) =>
  tables
    |> map(fn: (r) => ({
        r with
        _value: (r._value * 1.8) + 32.0
      })
    )

from(bucket: "homebucket")
  |> range(start: v.timeRangeStart, stop: v.timeRangeStop)
  |> filter(fn: (r) => r["_measurement"] == "mqtt_consumer")
  |> filter(fn: (r) => r["topic"] == "sensors/garage/temperature")
  |> convertCtoF()
  |> aggregateWindow(every: v.windowPeriod, fn: mean, createEmpty: false)
  |> yield(name: "mean")
The bottom part from(bucket: "homebucket"... is based on a query I created in the influx data explorer and then I added a quick conversion step from C˚ to F˚. This is influx’s flux query language which is not always easy to understand but between the reference docs and asking questions on their support forum, you can probably come up with what you want to do.
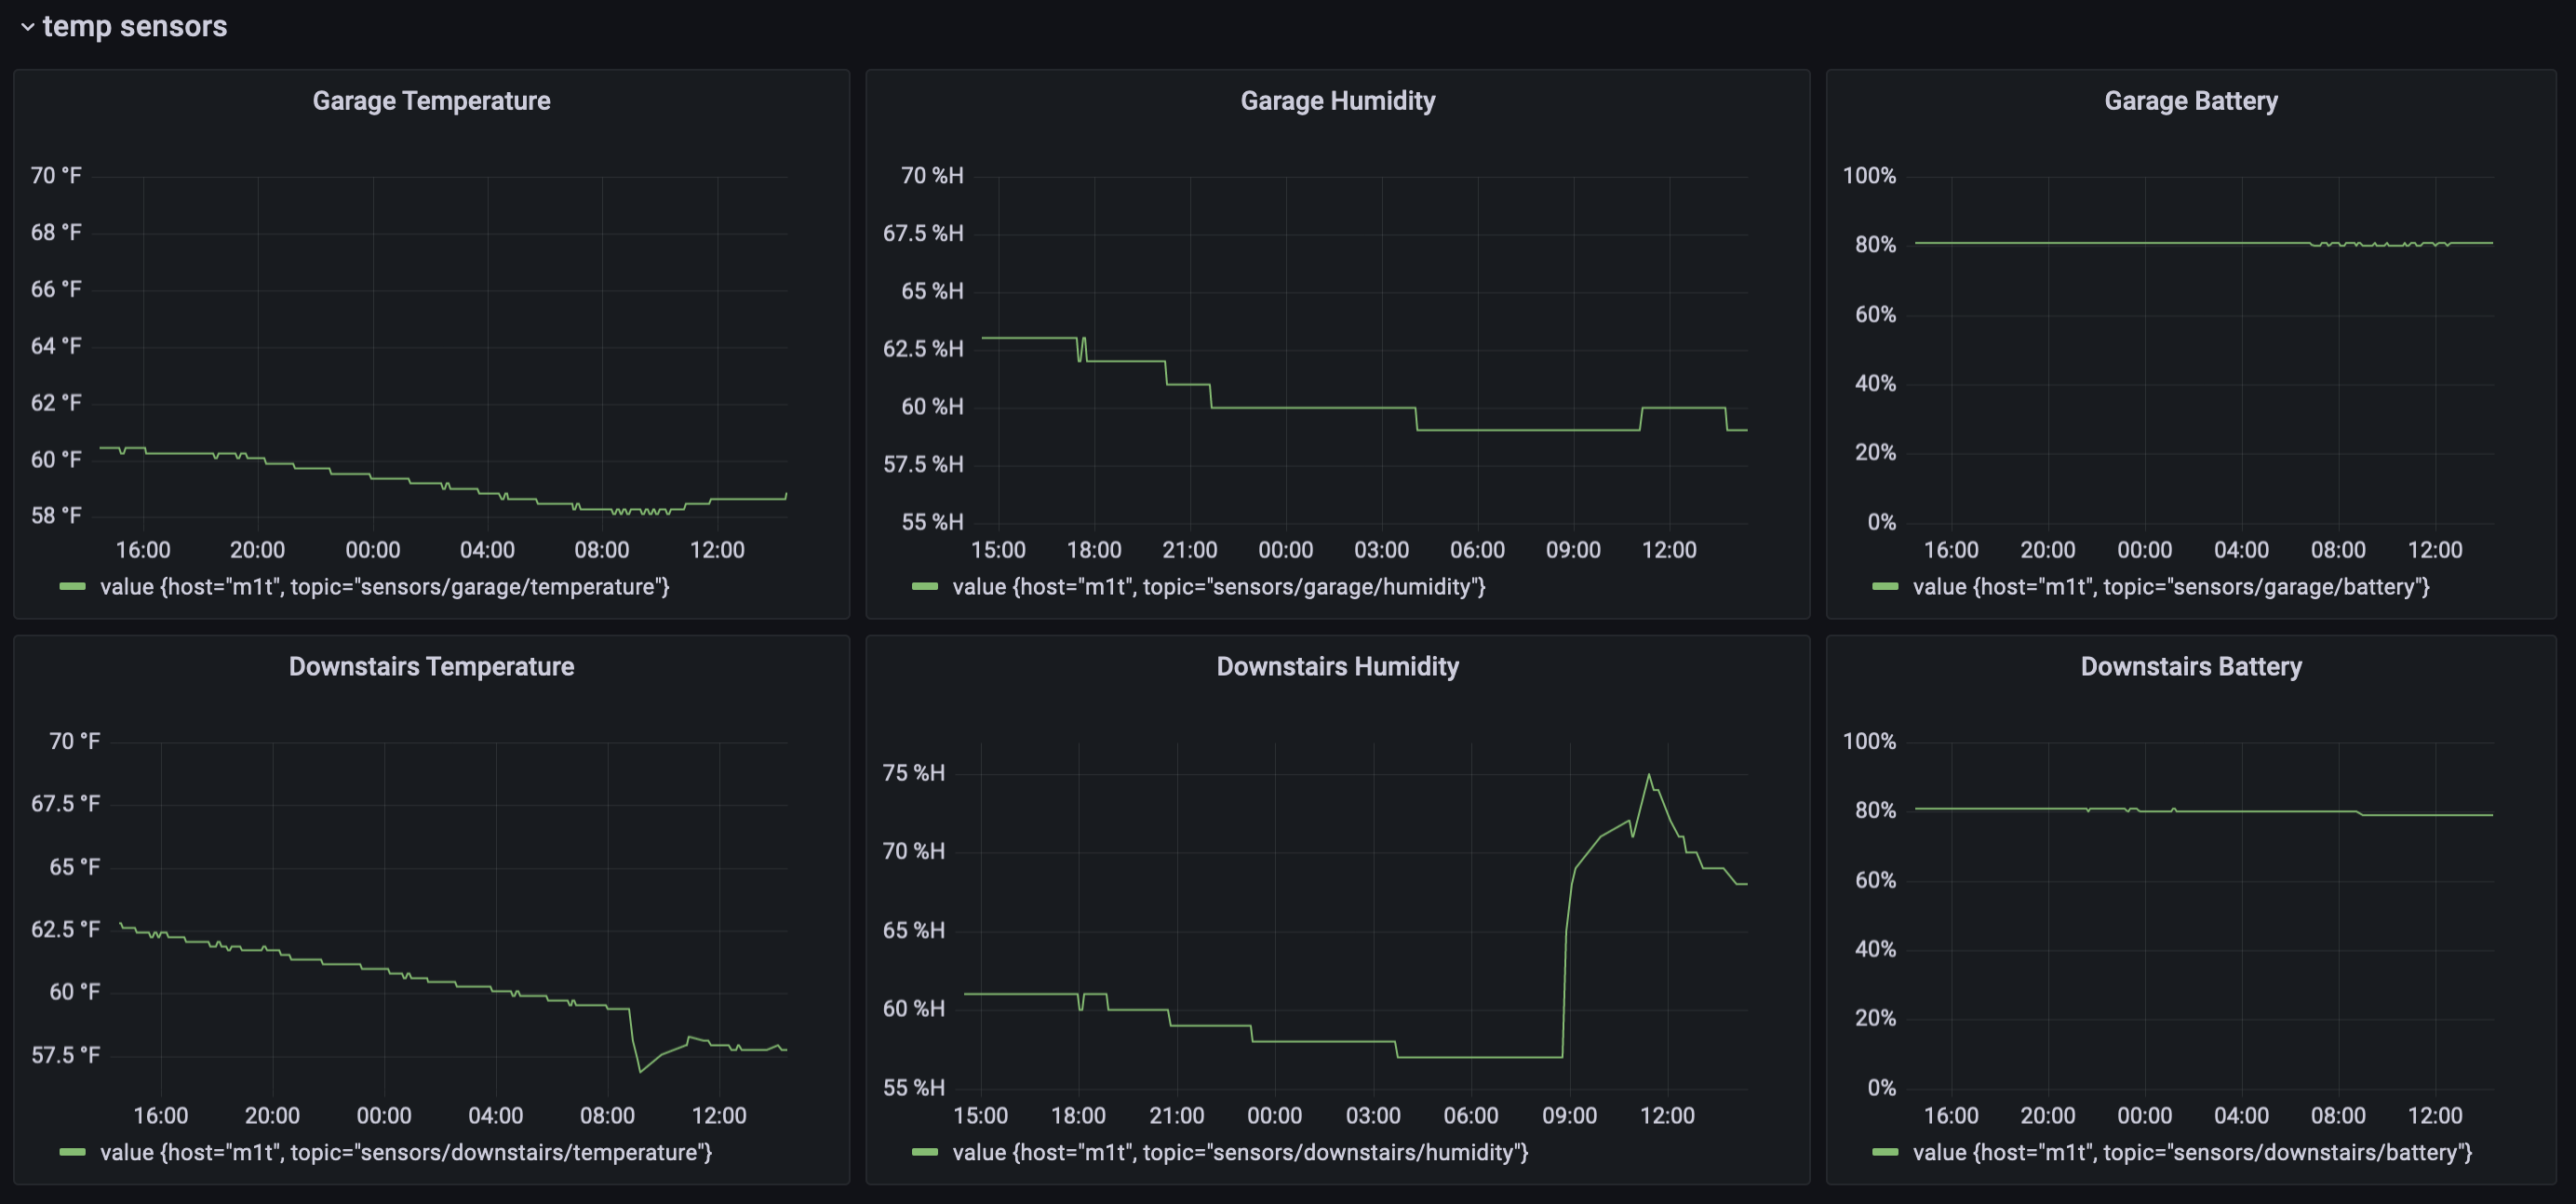
grafana graphs for two temperature sensors
Once you have the query set, you can continue to customize by adding a title, soft min and max values and, most importantly, your units.
additional sensors?
What else? Got other sensors that can be read over bluetooth and forwarded to influx? Random other things that can publish mqtt topics that are not homekit related? Now that you have the basics for an influx pipeline on your homebridge server, the possibilities are endless.
Questions? Did you extend this in fun ways? Let me know on Twitter.
Next time: let’s use our existing infrastructure to do home network monitoring!